The primary research focus was integrating models into seismic hazard, by using numerical simulations to account for site-specific effects. It was addressed by conducting two-dimensional simulations that analyzed the propagation of seismic waves through the ground and incorporating a non-linear constitutive model into QUAD4M, a FORTRAN software developed by researchers at the University of California, Davis.
According to Ayoubi et al. (2020), the basin effect refers to the amplifications resulting from seismic waves trapped in soft sedimentary deposits located above a concave-shaped rock base. This condition causes significant changes in the amplitude, duration, and frequency of seismic signals. This behavior has been observed and has played a significant role in various earthquakes (Campillo et al., 1989; Pitarka et al., 1996; Hallier et al., 2008; Asimaki et al., 2015; Makra et al., 2021).
Iso-accelerations
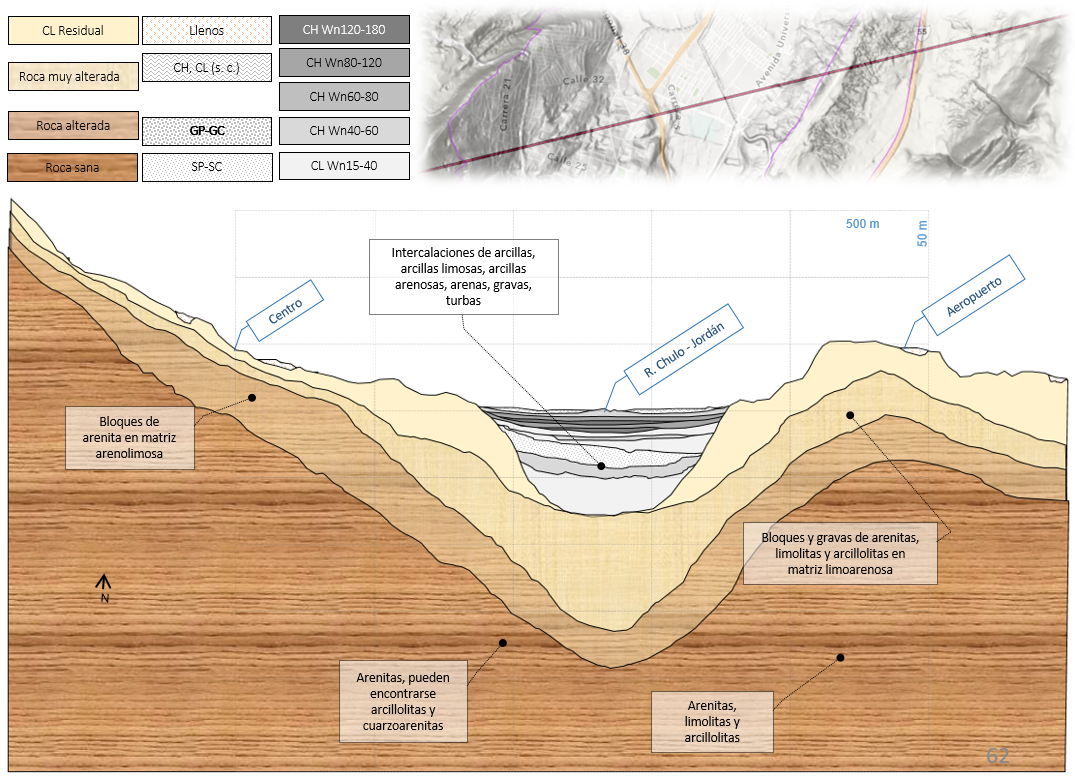
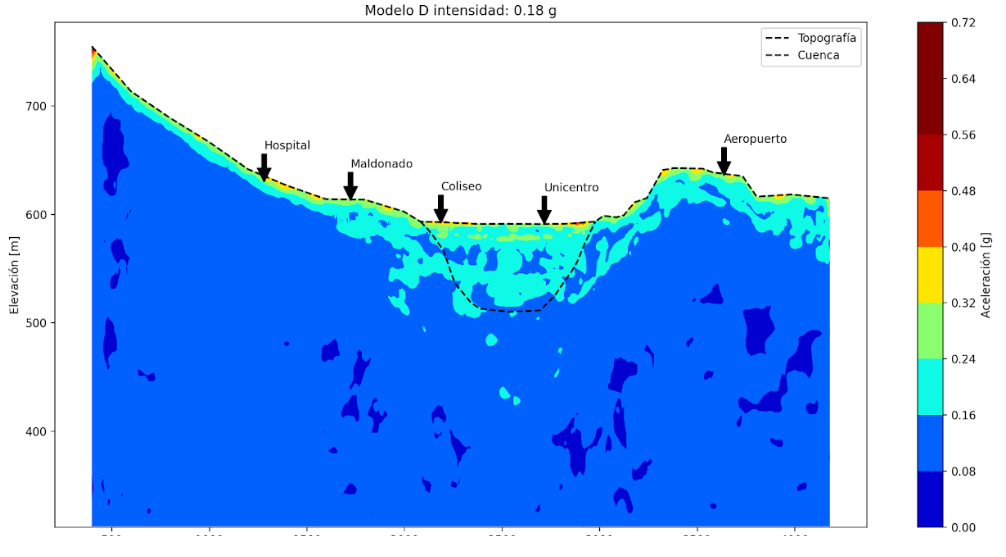
The results of our work are twofold: On Figure 1 (a), we highlight the sedimentary basin in gray, underscoring its complex structure and geological significance. On Figure 1 (b), we present iso-acceleration contours from our simulations, which identify areas within the basin at increased risk of seismic activity. This methodology not only advances our understanding of seismic wave behavior through complex geological formations but also aids in the precise identification of high-risk zones, contributing crucial data for seismic risk mitigation and urban planning in Tunja.
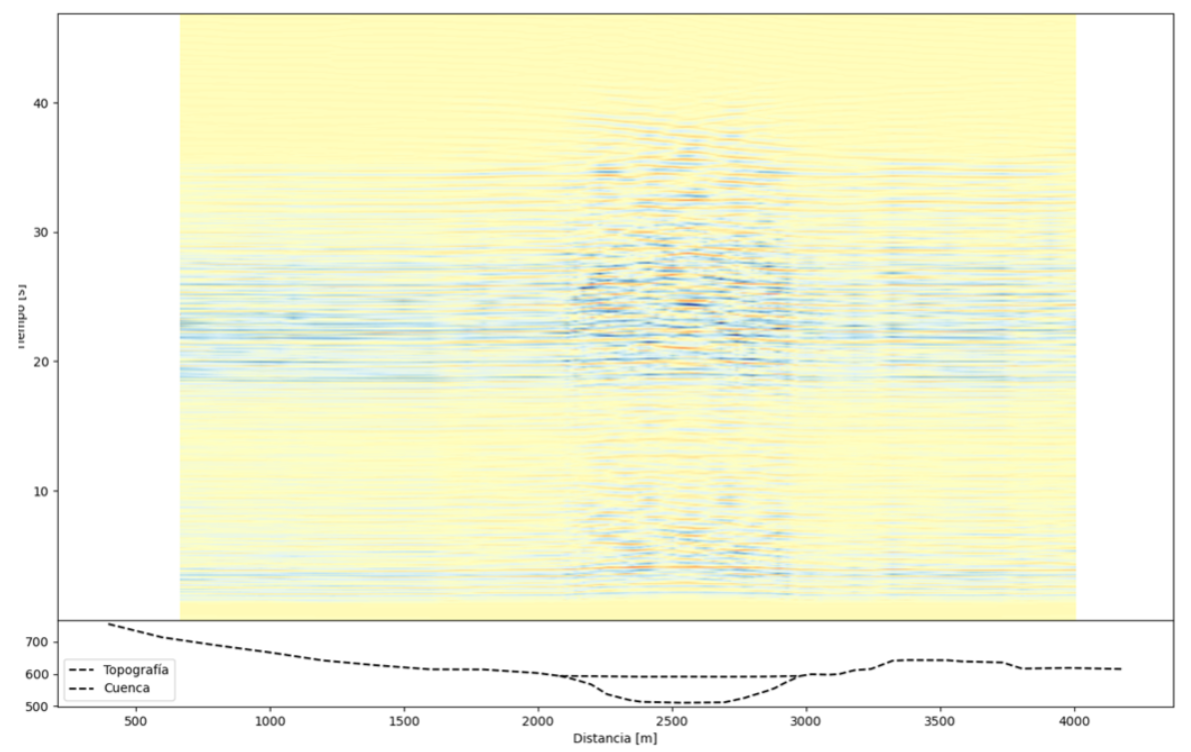
In our study, we’ve identified significant variations in the duration, amplitude, and frequency of seismic waves at nodes overlying sedimentary basins and topographic features, as shown in Figure 2.
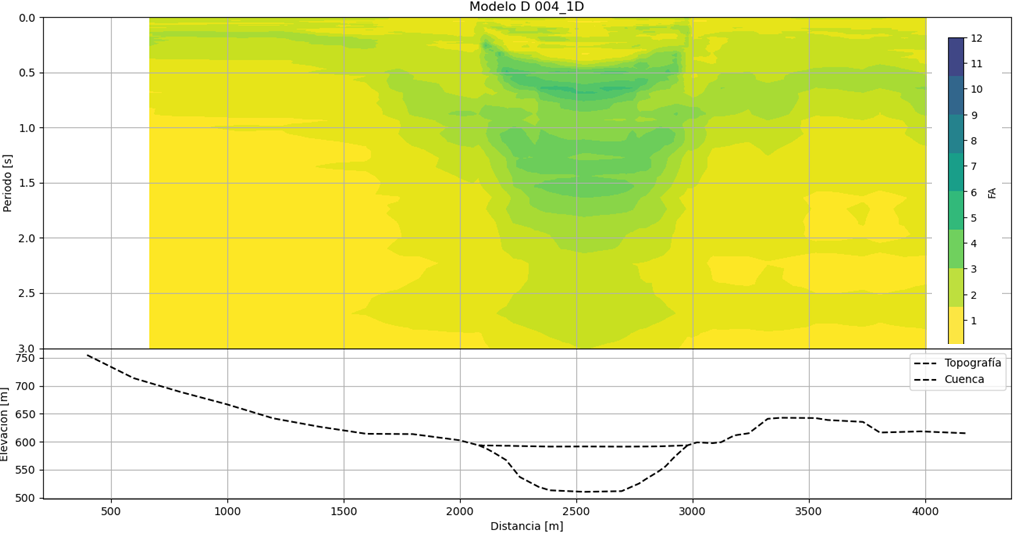
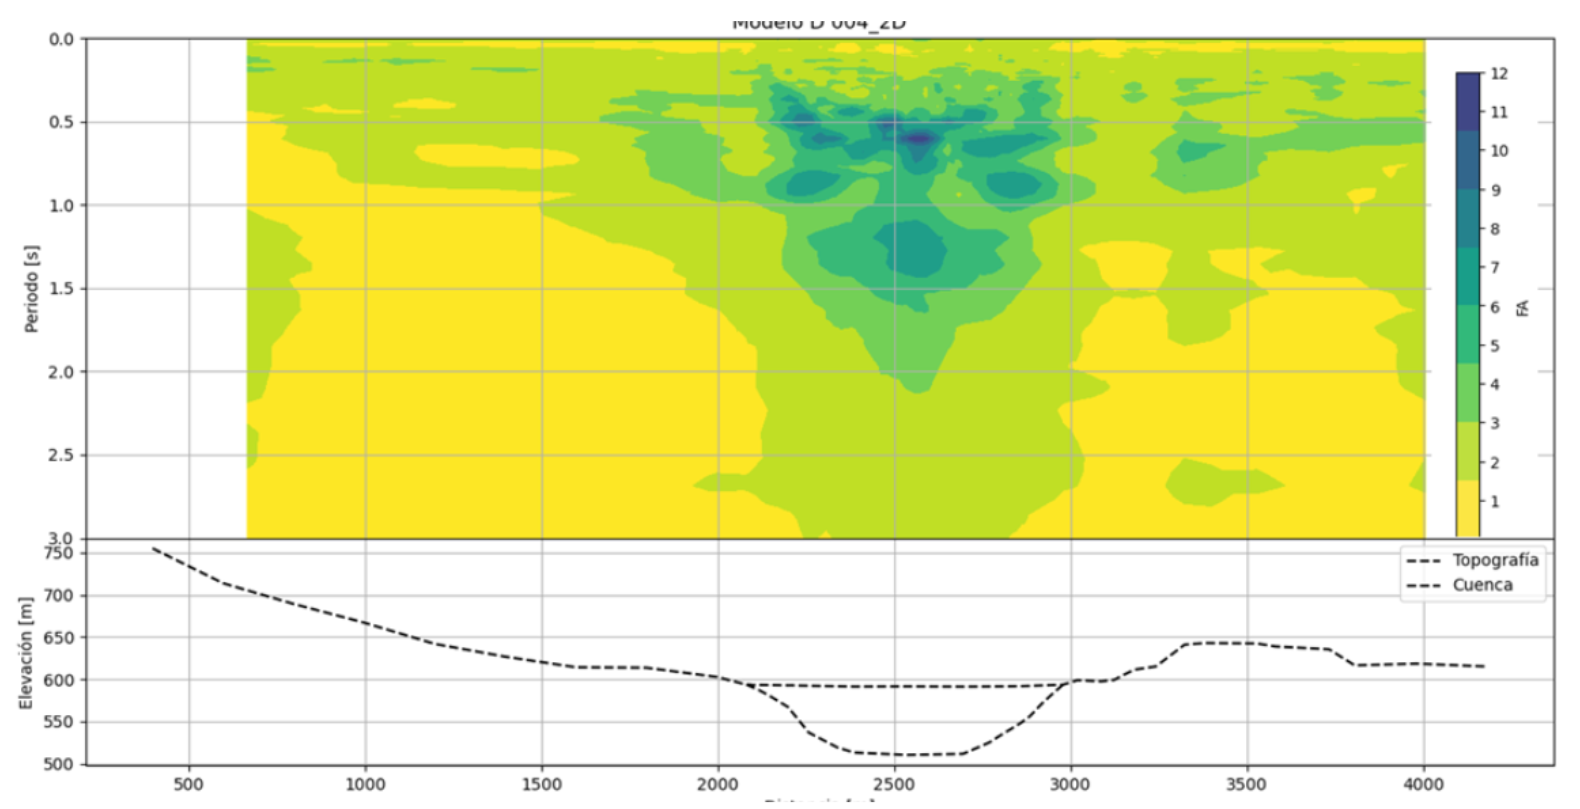
The Figure 3 (a) and Figure 3 (b) offer a detailed visualization through colormaps of amplification versus structural period, utilizing a color spectrum where more intense shades of blue signify higher amplifications, contrasting sharply with yellows that indicate lower amplifications. On the left, we observe the amplification outcomes derived from a one-dimensional model, providing a foundational yet simplified understanding of seismic wave amplifications across the basin. In Figure 3 (a), the amplifications depicted are the result of employing more complex two-dimensional models, offering a nuanced and comprehensive portrayal of seismic behavior.
Key observations from these models include:
Prominent Amplification in Basin’s Deepest Zones: Both the one-dimensional and two-dimensional models converge on the insight that the most significant amplifications are observed near the deepest zones of the basin. This correlation underscores the critical role of basin depth in influencing seismic wave amplification, a vital consideration for seismic risk assessment.
One-Dimensional Model Limitations: The one-dimensional model, while valuable for initial analyses, exhibits inherent limitations in its capacity to fully replicate the intricate features of the basin’s geology. This simplification results in a less accurate representation of how seismic waves interact with the basin’s complex structure.
Two-Dimensional Model’s Detailed Capture: In contrast, the two-dimensional model demonstrates a superior ability to accurately model and reflect the basin’s detailed geological features. This model successfully captures variations in seismic behavior that the one-dimensional model cannot, such as lateral variations in seismic wave speed and amplification due to the basin’s irregular shape and varying depth.
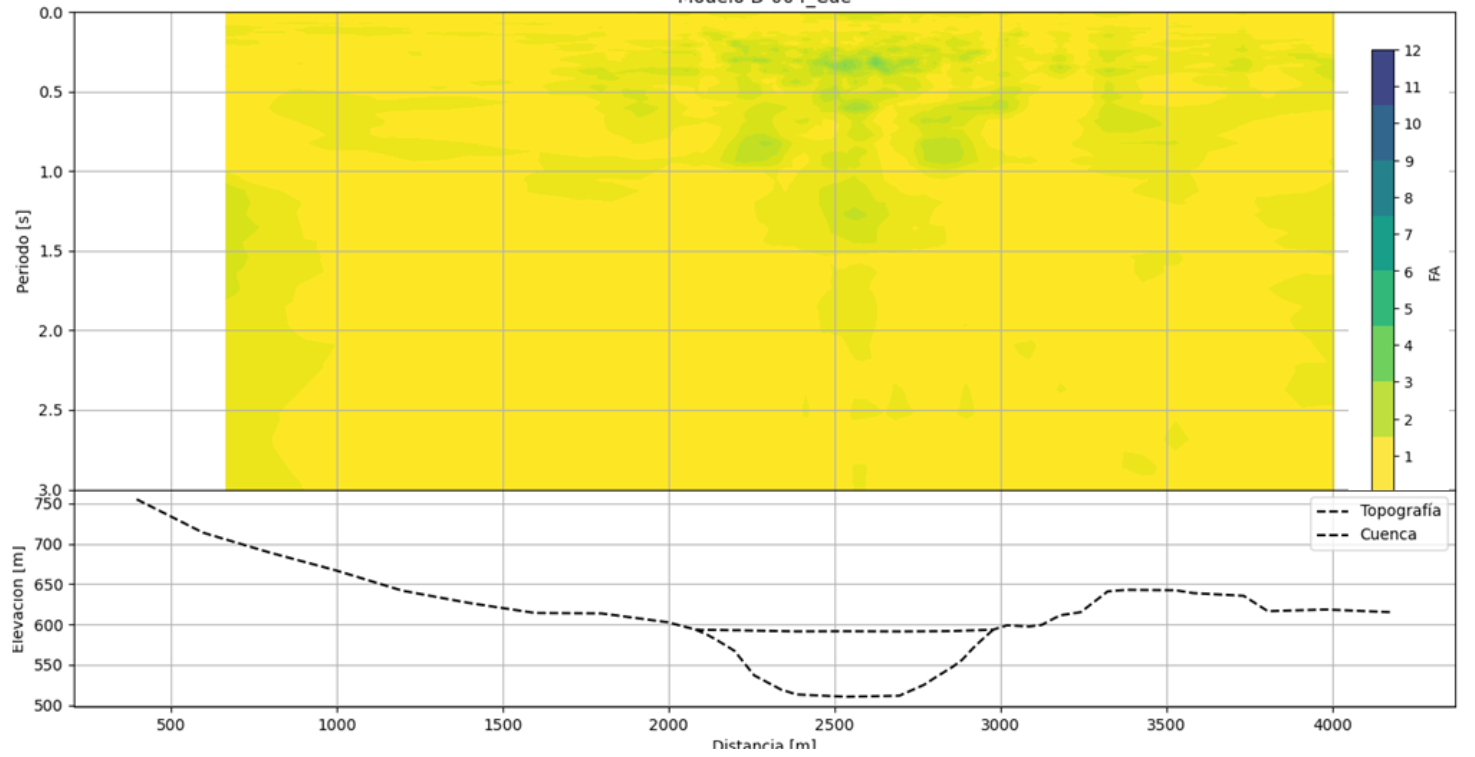
When I divide the results from the two-dimensional model by those from the one-dimensional model, I obtain the basin or topographic effect (Figure 4).
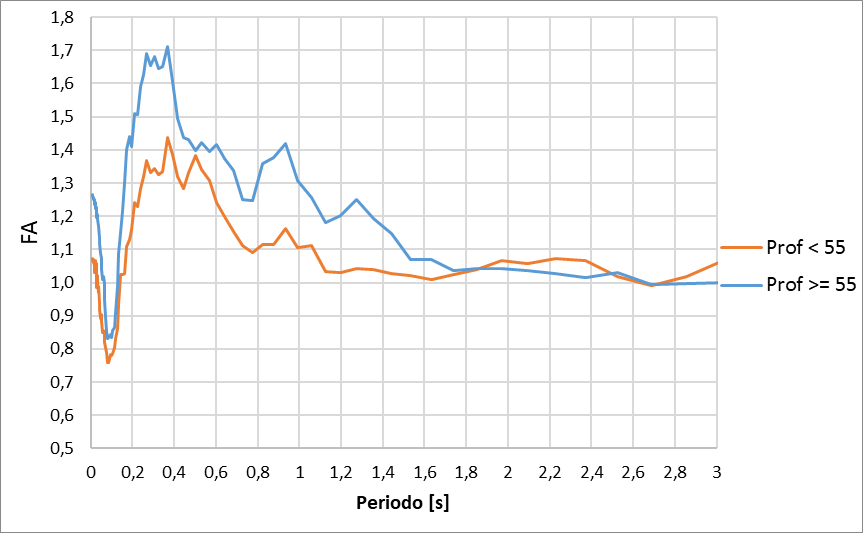
To effectively translate our seismic wave amplification findings into actionable guidelines for building codes, it became imperative to categorize the basin region according to its depth. This stratification is critical for tailoring construction standards that adequately reflect the varying seismic risks across different parts of the basin, as shown in Figure 5. In this specific analysis, I delineated the basin into two distinct zones based on depth: one encompassing areas of the basin above 55 kilometers and another for regions below this depth threshold.
This segmentation approach allows for a more nuanced understanding of seismic hazards, acknowledging that seismic amplification—and consequently, the potential for damage—varies significantly with depth. Areas above 55 kilometers may exhibit different seismic response characteristics compared to those below, impacting how structures within these zones should be designed and reinforced to withstand seismic events.